Remotely debug an application on SAP BTP
This guides outlines the steps you need to follow to start a remote debugging session from your IDE for an application that is already deployed on Cloud Foundry in SAP BTP.
Assign yourself as a Space Developer
You need to have the Space Manager or Org Manager role. For details see here.
- Open the SAP Business Technology Platform Cockpit and navigate to your subaccount
- Go to the space on Cloud Foundry where your application will be pushed to
- Click Member on the left side menu
- Add yourself as a Space Developer
Deploy Your Application with Debug Mode
In the package.json file, replace the start script to run in debug mode.
E.g., instead of node start.js for node, use:
node --inspect start.js
And instead of ts-node start.ts, use:
node -r ts-node/register --inspect start.ts
You can do this by either changing your start script in the package.json or the command script in the manifest.yml.
Don't use --inspect-brk, this will make the start timeout on SAP Business Technology Platform.
Deploy your application as usual by running the command:
cf deploy
Open an ssh Tunnel to Your Application
Open an ssh tunnel to your backend application to connect your local debugger with the node inspector running on port 9229.
Replace <your-app-name> with your application name and run:
$ cf ssh <your-app-name> -L 9229:127.0.0.1:9229 -T -N
Attach a Local Debugger
Now you can attach your local debugger. For this you will have to launch a debugger that attaches to the remote session.
Visual Studio Code
In Visual Studio Code, you can use the below attach configuration for Node.js debugging.
Replace YOUR_APPLICATION_PATH with the relative path to your application directory:
{
  "version": "0.2.0",
  "configurations": [
    {
      "type": "node",
      "request": "attach",
      "name": "Attach to Remote",
      "address": "127.0.0.1",
      "port": 9229,
      "localRoot": "${workspaceFolder}/YOUR_APPLICATION_PATH",
      "remoteRoot": "/home/vcap/app",
      "skipFiles": ["node_modules/**"]
    }
  ]
}
Webstorm
In Webstorm you can add configure debugging by creating a config as shown below:
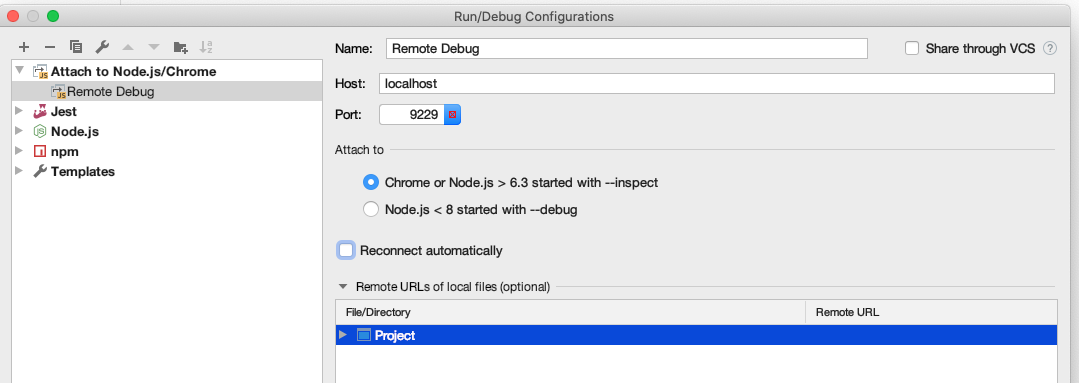
Start the debugger !